No other tools can challenge Excel’s stance in the data analysis world. I didn’t spot many computers that are not installed with it, and I assume that everybody who faces a computer during work has to use it sometime. With the power of VBA, it is all programmable and could realize very complicated purposes without any mouse-clicking. While it is very popular to compare SAS and R, I feel that it is also meaningful to compare SAS and VBA, since these two are both well supported proprietary softwares from the great companies.
Here the example is about cross tabulation and the following visualization with a stacked bar chart. Let’s borrow the small data set SASHELP.CLASS from SAS, which includes 19 teenagers. We are interested see the total height broken down by age and sex.
| Name | Sex | Age | Height | Weight |
| Alfred | M | 14 | 69 | 112.5 |
| Alice | F | 13 | 56.5 | 84 |
| Barbara | F | 13 | 65.3 | 98 |
| Carol | F | 14 | 62.8 | 102.5 |
| Henry | M | 14 | 63.5 | 102.5 |
| James | M | 12 | 57.3 | 83 |
| Jane | F | 12 | 59.8 | 84.5 |
| Janet | F | 15 | 62.5 | 112.5 |
| Jeffrey | M | 13 | 62.5 | 84 |
| John | M | 12 | 59 | 99.5 |
| Joyce | F | 11 | 51.3 | 50.5 |
| Judy | F | 14 | 64.3 | 90 |
| Louise | F | 12 | 56.3 | 77 |
| Mary | F | 15 | 66.5 | 112 |
| Philip | M | 16 | 72 | 150 |
| Robert | M | 12 | 64.8 | 128 |
| Ronald | M | 15 | 67 | 133 |
| Thomas | M | 11 | 57.5 | 85 |
| William | M | 15 | 66.5 | 112 |
VBA 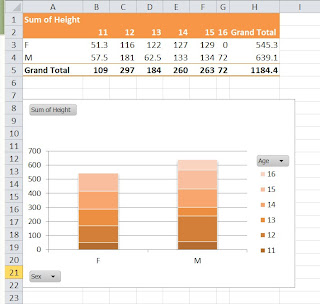
Pivot table has many wonderful features. It can easily aggregate data like OLAP with multiple dimensions, which makes it the most suitable tool for making cross tabs. Also because the pivot table define the fields, making a following pivot chart by codes is much more easier than any manual work.
Sub CreatePvt()
'   Set storage path for the pivot table
  Dim myPTCache As PivotCache, myPT As PivotTable
  Dim myPC As Chart

'   Delete the sheet containing the previous pivot table
  Application.ScreenUpdating = False
  On Error Resume Next
  Application.DisplayAlerts = False
  Sheets("Pivot table").Delete
  On Error GoTo 0

'   Create the cache
  Set myPTCache = ActiveWorkbook.PivotCaches.Create( _
      SourceType:=xlDatabase, SourceData:=Range("A1").CurrentRegion)

'   Add a new sheet for the pivot table
  Worksheets.Add
  ActiveSheet.Name = "Pivot table"

'   Create the pivot table
  Set myPT = ActiveSheet.PivotTables.Add( _
      PivotCache:=myPTCache, TableDestination:=Range("A1"))
'  Format the pivot table
   With myPT
       .AddFields RowFields:="Sex", _
           ColumnFields:="Age"
       With .PivotFields("Height")
           .Orientation = xlDataField
           ' Type of pivot table functions at http://goo.gl/F9rJh
           .Function = xlSum
           .Position = 1
        End With
       .NullString = "0"
       .DisplayFieldCaptions = False
       .TableStyle2 = "PivotStyleMedium14"
   End With

' Add the pivot chart
   Set ChartDataRange = myPT.TableRange1.Offset(1, 0).Resize(myPT.TableRange1.Rows.Count - 1)
   ActiveSheet.Shapes.AddChart.Select
   Set myPC = ActiveChart
' Format the pivot chart
   With myPC
       .SetSourceData Source:=ChartDataRange
      .ChartType = xlColumnStacked
      .SetElement (msoElementChartTitleAboveChart)
      .ChartTitle.Caption = " "
      .ChartStyle = 16
   End With
End Sub
SASIn SAS, PROC REPORT is a better procedure than its older predecessors like PROC FREQ and PROC TABULATE. Similarly, the SG procedures are significantly more flexible than PROC GPLOT.
* Clear the old html outputs;
ods html close;
ods html;

* Create the cross tabulation;
options missing = 0;
proc report data = sashelp.class nowd;
   columns sex age,height n;
   define sex / group ' ';
   define age / across ' ';
   define height / sum ' ';
   define n / 'Grand Total';
   rbreak after / summarize ;
run;

* Creat the statistical graph;
proc sgplot data = sashelp.class;
   vbar sex / response = height group = age;
   yaxis grid;
run;
ConclusionsIn this demo, SAS would allow fewer lines of codes. Excel/VBA can do the same job and is available everywhere. And they are both highly customizable, and bring a lot fun in creating a table or a chart.


