Sunday, October 28, 2012

SAS and VBA (8): What VBA can do for SAS?

The eventual answer is user interface (I really don't mean SAS/AF) with or without Excel.
In the Windows environment, SAS provides data access layer by ADO and ADO.NET. We can build the applications using SAS at the backend through ADO.NET. Since Visual Basic.NET has the similar syntax to VBA, if somebody is comfortable to code in Microsoft's Visual Studio, then developing a desktop app is always feasible although it requires quite a few efforts.

For example, let's run a simple linear regression using the variable of WEIGHT to predict HEIGHT based on the SASHELP.CLASS data set. We can use Excel's macro to fetch the output by SAS as a new result sheet in the same workbook. Similarly, a desktop application (.exe) will run SAS as batch mode without notice and return the regression result in a browser. The best part of developing such an application is that Excel or Visual Studio comes at nearly no cost. And as you know, the client doesn't need to know anything about SAS.

The UI in Excel

After hitting the button

The UI of a desktop app


After hitting the button

Friday, October 5, 2012

SAS and VBA (7): calculate running total

This is a simple routine for a lot of reporting work. Many people tend to do it in Excel by dragging the range after entering the formula in the 1st cell. However, coding in VBA and SAS will usually do it in more prompt and safe way.

VBA
VBA’s unique R1C1 formula is pretty handy once we get to know the rule. The 1st cell at the F column has different R1C1 formula than the cells below.

Sub Rt()
' Find the last row
FinalRow = Cells(Rows.Count, 2).End(xlUp).Row
Range("F1").Value = "Running total of Weight"
Range("F2").FormulaR1C1 = "=RC[-1]"
Range("F3:F" & FinalRow).FormulaR1C1 = "=RC[-1] + R[-1]C"
End Sub

SAS
It is incredibly easy to do the job in SAS. One line of code -- that is all! Obviously SAS beats VBA's three lines in this demo here.
data want;
set sashelp.class;
label total_weight = "Running total of Weight";
total_weight + weight;
run;

Wednesday, October 3, 2012

SAS and VBA (6) : delete empty rows

One tricky question of the data work is to delete empty rows/observations in a raw file. A code snippet is particular useful to handle such cases. At the mean time, we need to know how many rows are actually removed as the execution result. The good news is that as programmable softwares, Excel/VBA and SAS are both good at dealing this job. In a simple demo text file below, there are actually two empty lines that have to be removed.

  
ptno visit weight
1 1 122
1 2
1 3
1 4 123
2 1 156
2 3

3 1 112
3 2

4 1 125
4 2
4 3

VBA
VBA's CountA function is able to count the number of non-empty cells in any range of cells.Within a loop from the top to the bottom, it will help automatically remove those empty rows. In the codes, a message box is created to return the number of the rows deleted.


Sub DelEptRow()
Dim myRow, Counter As Integer
Application.ScreenUpdating = False
For myRow = ActiveSheet.UsedRange.Rows.Count To 1 Step -1
If Application.WorksheetFunction.CountA(Rows(myRow)) = 0 Then
Rows(myRow).Delete
Counter = Counter + 1
End If
Next myRow
Application.ScreenUpdating = True
' Display the number of rows that were deleted
If Counter > 0 Then
MsgBox Counter & " empty rows were removed"
Else
MsgBox "There is no empty row"
End If
End Sub


SAS
SAS can do the same thing with the combination of its MISSING function(decides if there is any missing value) and CATS function(concatenates all numerical and string variables and trims leading blanks). It is very convenient to apply the logic in a DATA STEP and let LOG tell how many lines are deleted.

data patient;  
input @1 ptno @3 visit @5 weight;
infile datalines missover;
cards;
1 1 122
1 2
1 3
1 4 123
2 1 156
2 3

3 1 112
3 2

4 1 125
4 2
4 3
;;;
run;

options missing = ' ';
data want;
set patient nobs = inobs end = eof;
if missing(cats(of _all_)) then delete;
* Display the number of rows that were deleted;
outobs + 1;
counter = inobs - outobs;
if eof then do;
if counter > 0 then put counter "empty rows were removed";
else put "There is no empty row";
end;
drop counter outobs;
run;

Conclusion
In a DATA STEP, SAS's implicit loop has two sides. The good side is that we do not need care about how to set up a loop most time which saves codes. The bad side is that sometimes it is hard to control which row we need to loop to.

Monday, October 1, 2012

SAS and VBA (5) : replace values quickly

SAS and VBA both have their unique and quick ways to replace values in one or multiple columns.

VBA
VBA has a wonderful function Replace for several columns or regions, where the changes are likely to be happened.
Sub Replace()
With Columns("B")
.Replace "F", "Female"
.Replace "M", "Male"
End With
End Sub

SAS
User-defined format by PROC FORMAT is the best way for quick replacements.


proc format;
value $sex
'F' = 'Female'
'M' = 'Male'
;
run;

data want;
set sashelp.class;
format sex $sex.;
run;

Conclusion
For some data management operations such as string/number replacement, it is better way to use the languages' built-in features, instead of the loops and condition statements.

Friday, September 28, 2012

SAS and VBA (4) : fill missing values with last valid observation

In many data management routines, it is common to fill the missing values with the last valid one. For example, we want to maintain the patient visit log about several patients, which records their weight for each visit. Given these patients’ absence for the appointments, the data analyst has to fill the the empty weight value with the last valid observation. This log includes three columns: patient ID, visit ID and weight.
ptno visit weight
1 1 122
1 2
1 3
1 4 123
2 1 156
2 3
3 1 112
3 2
4 1 125
4 2
4 3

VBA 
VBA is quite flexible at those occasions. If the cell has missing value, we can assign a R1C1 formula to the cell to obtain non-missing value directly from its top neighboring cell. As the result, the logic is a simple one-sentence clause.
Sub Locf()
' If a cell in the 3rd column is blank then fill with the previous non-missing value
Range("C1").CurrentRegion.SpecialCells(xlCellTypeBlanks).FormulaR1C1 = "=R[-1]C"
' Format patient ID with 000
Columns("A").NumberFormat = "000"
End Sub

SAS

In SAS, we need to set up a temporary variable in a DATA STEP to memorize the valid value by the RETAIN statement. Then a conditional structure is used to exchange the values between the weight variable and the temporary variable.
data patient;  
input @1 ptno @3 visit @5 weight;
infile datalines missover;
cards;
1 1 122
1 2
1 3
1 4 123
2 1 156
2 3
3 1 112
3 2
4 1 125
4 2
4 3
;;;
run;

data result;
set patient;
* Format patient ID with 000;
format ptno z3. ;
retain tempvar 0;
if missing(weight) = 1 then weight = tempvar;
else tempvar = weight;
drop tempvar;
run;

Conclusion
SAS is a procedural language, while VBA enjoy its power based on its many objects and properties. However, one common thing in writing good codes for both of them is to avoid the unnecessary explicit loops.

SAS and VBA (3) : lower triangle multiplication table


Flow control and looping is a very important aspect for any programming language. To see how to index a particular value in the languages’ default data type, creating a lower triangle multiplication table looks like a good test, since it is a simple question but still requires the skills to implement a nested loop and a condition statement.

VBA 

Excel has row number (1, 2, etc.) and column number (A, B, etc.) for each cell. Then in VBA, we can use Range() or Cells() to select those cells in any particular worksheet. So it will be very easy to implement the logic in VBA to create a lower triangle multiplication table.

Sub Mt()
ActiveSheet.Range("A:Z").EntireColumn.Clear
For i = 1 To 9
For j = 1 To 9
If i >= j Then
Cells(i, j) = i*j
End If
Next j
Next i
MsgBox "Done"
End Sub

SAS 

SAS’s data set doesn’t have exact indexes for row or column. There is internal automatic variables, which is _N_, for rows. However, to specify the columns, we have to declare a temporary array. And in this demo, the position of the OUPUT statement has to be between the inner loop and the outer loop.

data mt;
array a[9] col1-col9;
do i = 1 to 9;
do j= 1 to 9;
if i >= j then a[j] = i*j;
end;
output;
end;
drop i j;
put "Done";
run;

Conclusion 
To select a few columns or variables, array is a must in SAS. That is possible why the DATA STEP array is so important in SAS. For beginners, VBA is an easier way to apply loops.

Thursday, September 27, 2012

SAS and VBA (2) : cross tabulation and bar chart

No other tools can challenge Excel’s stance in the data analysis world. I didn’t spot many computers that are not installed with it, and I assume that everybody who faces a computer during work has to use it sometime. With the power of VBA, it is all programmable and could realize very complicated purposes without any mouse-clicking. While it is very popular to compare SAS and R, I feel that it is also meaningful to compare SAS and VBA, since these two are both well supported proprietary softwares from the great companies.

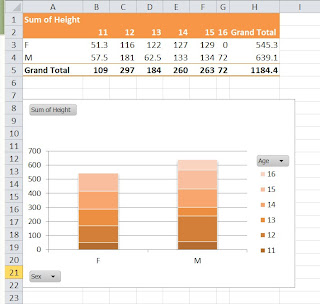
Here the example is about cross tabulation and the following visualization with a stacked bar chart. Let’s borrow the small data set SASHELP.CLASS from SAS, which includes 19 teenagers. We are interested see the total height broken down by age and sex.
Name Sex Age Height Weight
Alfred M 14 69 112.5
Alice F 13 56.5 84
Barbara F 13 65.3 98
Carol F 14 62.8 102.5
Henry M 14 63.5 102.5
James M 12 57.3 83
Jane F 12 59.8 84.5
Janet F 15 62.5 112.5
Jeffrey M 13 62.5 84
John M 12 59 99.5
Joyce F 11 51.3 50.5
Judy F 14 64.3 90
Louise F 12 56.3 77
Mary F 15 66.5 112
Philip M 16 72 150
Robert M 12 64.8 128
Ronald M 15 67 133
Thomas M 11 57.5 85
William M 15 66.5 112
VBA
                                      

Pivot table has many wonderful features. It can easily aggregate data like OLAP with multiple dimensions, which makes it the most suitable tool for making cross tabs. Also because the pivot table define the fields, making a following pivot chart by codes is much more easier than any manual work.
Sub CreatePvt()
' Set storage path for the pivot table
Dim myPTCache As PivotCache, myPT As PivotTable
Dim myPC As Chart

' Delete the sheet containing the previous pivot table
Application.ScreenUpdating = False
On Error Resume Next
Application.DisplayAlerts = False
Sheets("Pivot table").Delete
On Error GoTo 0

' Create the cache
Set myPTCache = ActiveWorkbook.PivotCaches.Create( _
SourceType:=xlDatabase, SourceData:=Range("A1").CurrentRegion)

' Add a new sheet for the pivot table
Worksheets.Add
ActiveSheet.Name = "Pivot table"

' Create the pivot table
Set myPT = ActiveSheet.PivotTables.Add( _
PivotCache:=myPTCache, TableDestination:=Range("A1"))
' Format the pivot table
With myPT
.AddFields RowFields:="Sex", _
ColumnFields:="Age"
With .PivotFields("Height")
.Orientation = xlDataField
' Type of pivot table functions at http://goo.gl/F9rJh
.Function = xlSum
.Position = 1
End With
.NullString = "0"
.DisplayFieldCaptions = False
.TableStyle2 = "PivotStyleMedium14"
End With

' Add the pivot chart
Set ChartDataRange = myPT.TableRange1.Offset(1, 0).Resize(myPT.TableRange1.Rows.Count - 1)
ActiveSheet.Shapes.AddChart.Select
Set myPC = ActiveChart
' Format the pivot chart
With myPC
.SetSourceData Source:=ChartDataRange
.ChartType = xlColumnStacked
.SetElement (msoElementChartTitleAboveChart)
.ChartTitle.Caption = " "
.ChartStyle = 16
End With
End Sub
SAS

In SAS, PROC REPORT is a better procedure than its older predecessors like PROC FREQ and PROC TABULATE. Similarly, the SG procedures are significantly more flexible than PROC GPLOT.
* Clear the old html outputs;
ods html close;
ods html;

* Create the cross tabulation;
options missing = 0;
proc report data = sashelp.class nowd;
columns sex age,height n;
define sex / group ' ';
define age / across ' ';
define height / sum ' ';
define n / 'Grand Total';
rbreak after / summarize ;
run;

* Creat the statistical graph;
proc sgplot data = sashelp.class;
vbar sex / response = height group = age;
yaxis grid;
run;
Conclusions

In this demo, SAS would allow fewer lines of codes. Excel/VBA can do the same job and is available everywhere. And they are both highly customizable, and bring a lot fun in creating a table or a chart.